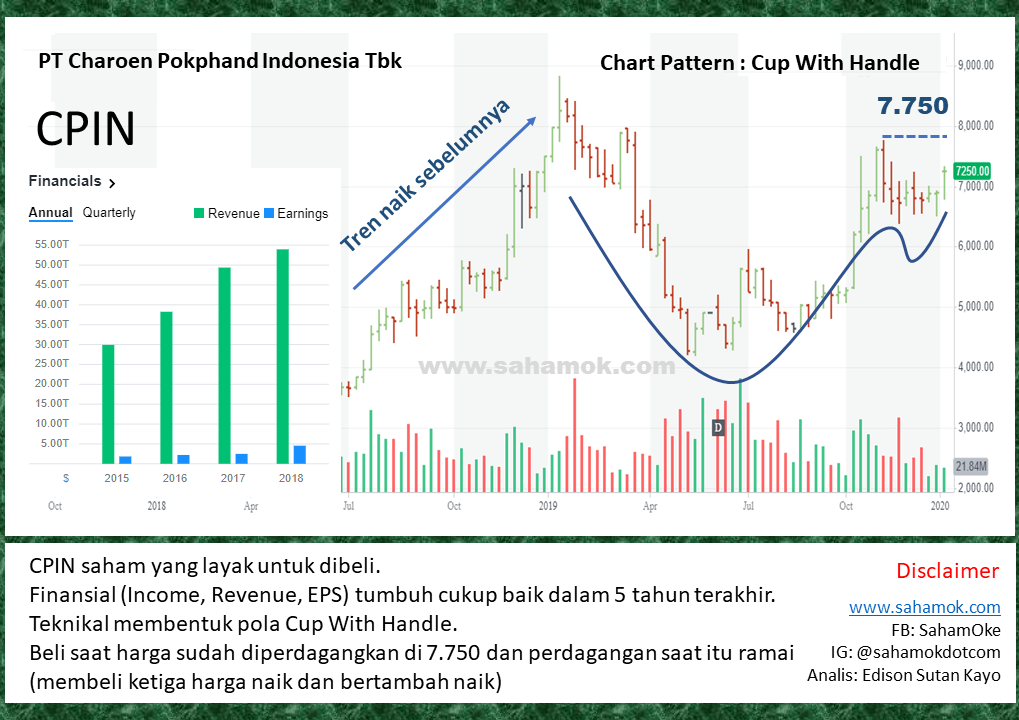
Analisis saham CPIN secara teknikal
CPIN saham yang layak untuk dibeli. Finansial (Income, Revenue, EPS) tumbuh cukup baik dalam 5 tahun terakhir. Analisis saham CPIN secara teknikal membentuk pola Cup With Handle. Beli saat harga sudah diperdagangkan di 7.750 dan perdagangan saat itu ramai (membeli ketiga harga naik dan bertambah naik)
Income Statement
| Breakdown |
TTM |
12/30/2018 |
12/30/2017 |
12/30/2016 |
|
Total Revenue |
58,471,882,000 |
53,957,604,000 |
49,367,386,000 |
38,256,857,000 |
|
Cost of Revenue |
50,757,145,000 |
44,822,755,000 |
43,116,098,000 |
31,743,222,000 |
|
Gross Profit |
7,714,737,000 |
9,134,849,000 |
6,251,288,000 |
6,513,635,000 |
|
Operating Expenses |
||||
|
Research Development |
– |
– |
– |
– |
|
Selling General and Administrative |
1,537,542,000 |
1,414,196,000 |
1,465,379,000 |
1,104,627,000 |
|
Total Operating Expenses |
2,841,387,000 |
2,728,608,000 |
2,604,097,000 |
2,171,222,000 |
|
Operating Income or Loss |
4,873,350,000 |
6,406,241,000 |
3,647,191,000 |
4,342,413,000 |
|
Interest Expense |
376,907,000 |
401,195,000 |
421,436,000 |
544,515,000 |
|
Total Other Income/Expenses Net |
– |
– |
– |
– |
|
Income Before Tax |
4,596,101,000 |
5,907,351,000 |
3,255,705,000 |
3,983,661,000 |
|
Income Tax Expense |
942,848,000 |
1,355,866,000 |
758,918,000 |
1,731,848,000 |
|
Income from Continuing Operations |
3,653,253,000 |
4,551,485,000 |
2,496,787,000 |
2,251,813,000 |
|
Net Income |
3,652,785,000 |
4,554,391,000 |
2,497,765,000 |
2,220,561,000 |
|
Net Income available to common shareholders |
3,652,785,000 |
4,554,391,000 |
2,497,765,000 |
2,220,561,000 |
|
Reported EPS |
||||
|
Basic |
– |
278 |
152 |
135.42 |
|
Diluted |
– |
278 |
152 |
135.42 |
|
Weighted average shares outstanding |
||||
|
Basic |
– |
16,398,000 |
16,398,000 |
16,398,000 |
|
Diluted |
– |
16,398,000 |
16,398,000 |
16,398,000 |
|
EBITDA |
– |
6,425,782,000 |
3,738,787,000 |
4,578,249,000 |
Balance Sheet
| Breakdown |
12/30/2018 |
12/30/2017 |
12/30/2016 |
|
Assets |
|||
|
Current Assets |
|||
|
Cash |
|||
|
Cash And Cash Equivalents |
2,803,131,000 |
1,793,454,000 |
2,504,434,000 |
|
Short Term Investments |
– |
1,990,000 |
20,870,000 |
|
Total Cash |
2,803,131,000 |
1,795,444,000 |
2,525,304,000 |
|
Net Receivables |
2,777,650,000 |
2,359,678,000 |
2,316,015,000 |
|
Inventory |
6,155,542,000 |
5,696,607,000 |
5,109,719,000 |
|
Other Current Assets |
1,591,235,000 |
1,342,722,000 |
1,311,262,000 |
|
Total Current Assets |
14,097,959,000 |
11,720,730,000 |
12,059,433,000 |
|
Non-current assets |
|||
|
Property, plant and equipment |
|||
|
Gross property, plant and equipment |
17,210,525,000 |
15,785,242,000 |
15,096,948,000 |
|
Accumulated Depreciation |
-5,427,533,000 |
-4,611,204,000 |
-3,829,713,000 |
|
Net property, plant and equipment |
11,782,992,000 |
11,174,038,000 |
11,267,235,000 |
|
Equity and other investments |
– |
– |
– |
|
Goodwill |
444,803,000 |
444,803,000 |
444,803,000 |
|
Intangible Assets |
41,461,000 |
55,159,000 |
101,418,000 |
|
Other long-term assets |
176,901,000 |
160,867,000 |
108,083,000 |
|
Total non-current assets |
13,547,159,000 |
12,801,863,000 |
12,145,561,000 |
|
Total Assets |
27,645,118,000 |
24,522,593,000 |
24,204,994,000 |
|
Total Revenue |
1,700,000,000 |
2,880,775,000 |
2,963,819,000 |
|
Accounts Payable |
1,445,313,000 |
1,023,280,000 |
1,266,946,000 |
|
Taxes payable |
– |
– |
– |
|
Accrued liabilities |
– |
– |
– |
|
Deferred revenues |
– |
– |
– |
|
Other Current Liabilities |
– |
– |
465,832,000 |
|
Total Current Liabilities |
4,732,868,000 |
5,059,552,000 |
5,550,257,000 |
|
Non-current liabilities |
|||
|
Long Term Debt |
2,749,829,000 |
3,005,172,000 |
3,646,082,000 |
|
Deferred taxes liabilities |
88,240,000 |
73,113,000 |
90,938,000 |
|
Deferred revenues |
– |
– |
– |
|
Other long-term liabilities |
– |
– |
515,760,000 |
|
Total non-current liabilities |
3,521,076,000 |
3,760,216,000 |
4,497,494,000 |
|
Total Liabilities |
8,253,944,000 |
8,819,768,000 |
10,047,751,000 |
|
Stockholders’ Equity |
|||
|
Common Stock |
163,980,000 |
163,980,000 |
163,980,000 |
|
Retained Earnings |
19,203,849,000 |
15,512,762,000 |
13,966,362,000 |
|
Accumulated other comprehensive income |
– |
– |
– |
|
Total stockholders’ equity |
19,375,720,000 |
15,684,633,000 |
14,137,991,000 |
|
Total liabilities and stockholders’ equity |
27,645,118,000 |
24,522,593,000 |
24,204,994,000 |
Pertumbuhan Finansial – Analisis saham CPIN
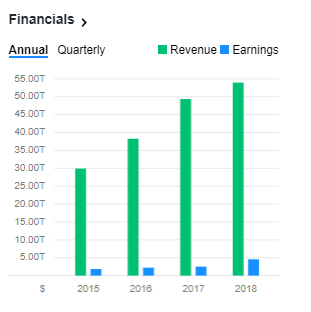
Sumber Data : Yahoo Finance
Download PDF Analisis saham CPIN (Teknikal dan Fundamental) Jan 2020

